Differential expression analysis#
Method#
DESeq2 was used on my laptop on the count tables of reads mapped to each gene to compare gene expression between conditions mineral vs. continuous culture.
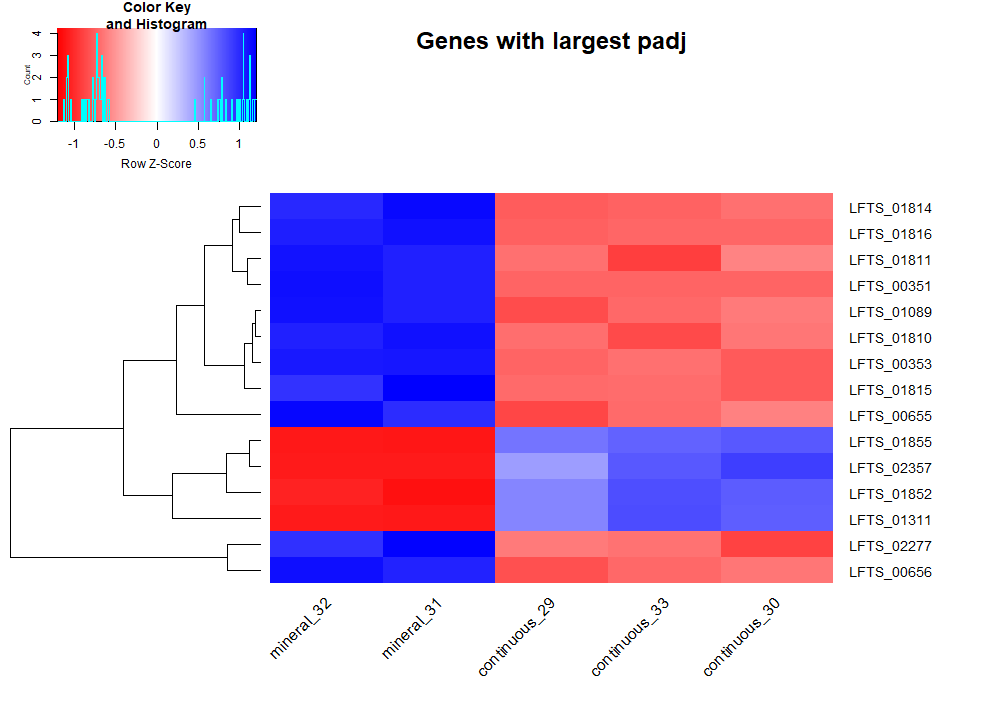
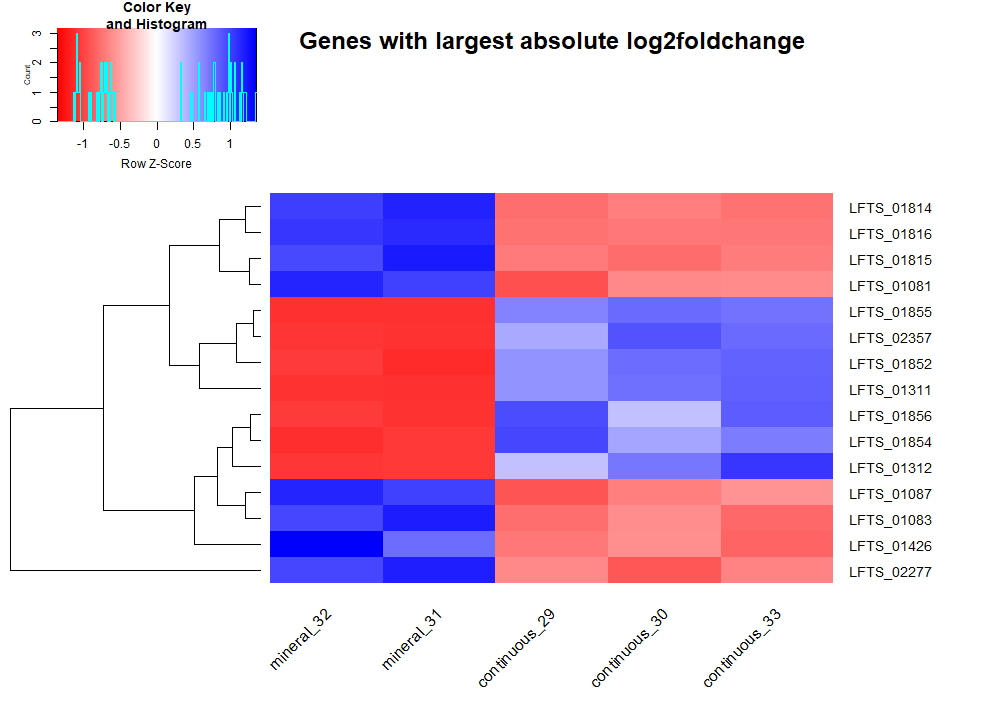
After loading the data, DESeq analysis (script) was ran. Condition was set to be continuous vs mineral cultures. Fold change was calculated as continuous values divided by mineral values, hence negative log2 fold change indicate gene expression upregualation in mineral cultures. Log 2 transform is to make change in increased and decreased directions having equal distance. 15 genes with smallest adjusted p value and 15 genes with largest absolute log2 fold change are selected to plot heatmaps, showing the most differentially expressed genes in 2 conditions.
Results and discussion#
The result table containing all the genes can be seen here.


From the heatmaps, we can pick some genes and refer to annotation files to discuss their biological interpretations. Some are hypothetical proteins, others indicate clear adaptions to the mineral environment.
LFTS_00351, LFT2_00353, LFTS_01814, LFTS_01815, LFTS_01816 are related to cation efflux system
LFTS_00655, LFTS_00656, LFTS_01081, LFTS_01087, LFTS_01089 are related to flagella
They are upregulated in mineral culture with large magnitude compared to continuous culture. It is reasonable since growth on mineral comes with a high exposure of cells to heavy metals such as copper. The bacterial need efflux pump to mitigate the detrimental effect of heavy metals.
Rapid attachment to the mineral surface is critical in biomining. Bacterial use flagella to move and sense chemicals outside the cell. Hence the upregulation of genes involving the synthesis and function of flagella is helpful for biofilm formation on the ore surface.
Q & A#
Expression analyses#
If your expression results differ from those in the published article, why could it be?
It could be due to low assembly quality, inaccurate annotations, mapping errors, lack of normalization.
How do the different samples and replicates cluster together?
They are clustered together by similarity, which is represented by the distance of samples calculated using the normalized count values.
What effect and implications has the p-value selection in the expression results?
P value indicates the probability that a fold change as strong as the observed one or even stronger, assuming the null hypothesis is correct.
What is the q-value and how does it differ from the p-value? Which one should you use to determine if the result is statistically significant?
In multiple testing, some genes will end up with significant p-value just by chance, leading to false positives. Q-value, or adjust p-value, is calculated as false discovery rate. Q-value should be used.
Do you need any normalization step? What would you normalize against? Does DESeq do it?
Normalization is required and is performed internally in DESeq. Data can be normalized by library size, gene length, etc.
What would you do to increase the statistical power of your expression analysis?
Obtain more data from more replicates. Increase significance level to increase the probability of rejecting null hypothesis, thus reduce the risk or type II errors.